When white families fled public schools and blacks left the city, racial makeup of the district changed
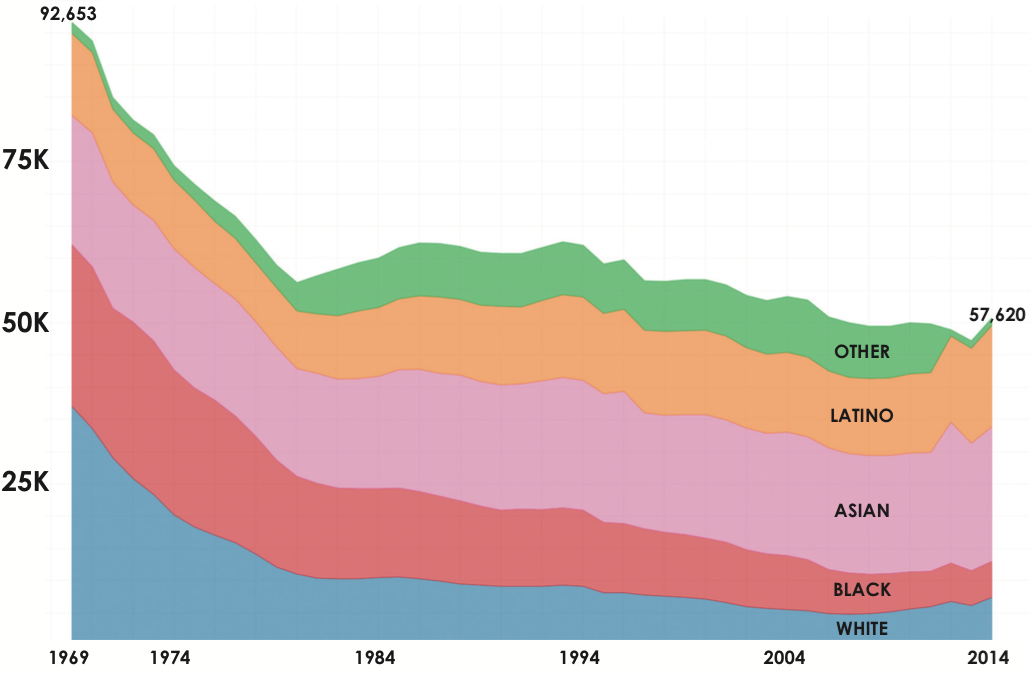
Over five decades, San Francisco saw a demographic transformation in its public school system.
In 1969, white and black students together were the majority, as in most of the rest of the United States. Since then, San Francisco public school enrollment has fallen by 39 percent, and almost all the missing faces are white or black. But the two groups have not disappeared in the same way.
Many black families left San Francisco. Some estimates now put the city’s overall black population at 5 percent. As of last year, the district said 8 percent of students were black. That is down from a peak of 30 percent of students in the 1970s.
Whites have not followed the same trajectory. Their numbers have also fallen, but they still make up 43 percent of the city’s population. However, whites now form the second smallest of the four major racial groups in the San Francisco Unified School District.
Almost 30 percent of children in San Francisco attend private schools — the highest rate of private-school attendance in California, and the third-highest in the nation. An exact count is not available, but public data suggest that the majority of students from high-income white families attend private schools.
Latinos and Asians together became the majority of all students in public schools simply because their numbers held steady through the years. Asians now account for 36 percent and Latinos 27 percent.
Sources and methodology
Because San Francisco Unified has not continuously surveyed student enrollment the same way over time, the Public Press worked with three different databases using divergent methodologies.
For 1969 to 2011, we used San Francisco school district data, with one discontinuity in 1995 as students in nonstandard school programs were excluded and another in 2006 because the district stopped counting students at charter schools. Our data from the last three years come from the California Department of Education website, which results in another inconsistency. The state data do not include a category for those who declined to state a race.
For the sake of consistency with U.S. Census Bureau practices, we grouped the categories of Japanese, Korean, Filipino and Chinese as “Asian.” Because they are all relatively small populations in San Francisco, Native Americans, Pacific Islanders and everyone who declined to state a race are counted in “other.”
On the problem of race
The messiness of data collection is an indication of the shifting ways our education system thinks about ethnicity. And it makes the analysis of racial clustering an inherently inexact science.
There are significant problems in describing demographics. The ways we count and group different populations have changed over time, and this often clashes with the ways individuals and communities define themselves.
- “Latino” and “Hispanic” are categories that can include Spaniards, black people from Cuba, Portuguese-speaking Brazilians of Yoruba descent, Mixtec and Zapotec people from Mexico, and so on. And each of those groups may define itself in yet other terms.
- The categories of “Asian” and “Pacific Islander” often includes disparate groups that are not at all alike, from the Tatars of Russia to the Bhote of Bhutan to the Hiligaynon of the Philippines. At some points, Native Americans have even been counted as Asian.
- “White” has not always encompassed Jews or Italians.
- The terms “black” and “African-American” often do not include immigrants from North Africa, depending on who is issuing the survey.
Similarly, many residents of the San Francisco of 2015 are of mixed-race – and they may be the city’s fastest-growing racial category. But government agencies have counted multiracial people in different ways throughout the years.
San Francisco Unified recently changed the way it records the race of its students. The most recent report on school assignment and demographics includes “Chinese” and “other nonwhite” as categories in 2008, but uses the term “Asian” in 2013. This shift makes it difficult to do year-to-year comparisons.
This story was published in the winter 2015 print edition of the Public Press. For the full report rolling out online through early February, see sfpublicpress.org/schooldiversity. To read the 2014 report on the effects of parent fundraising and (follow-up coverage), see sfpublicpress.org/publicschools.


