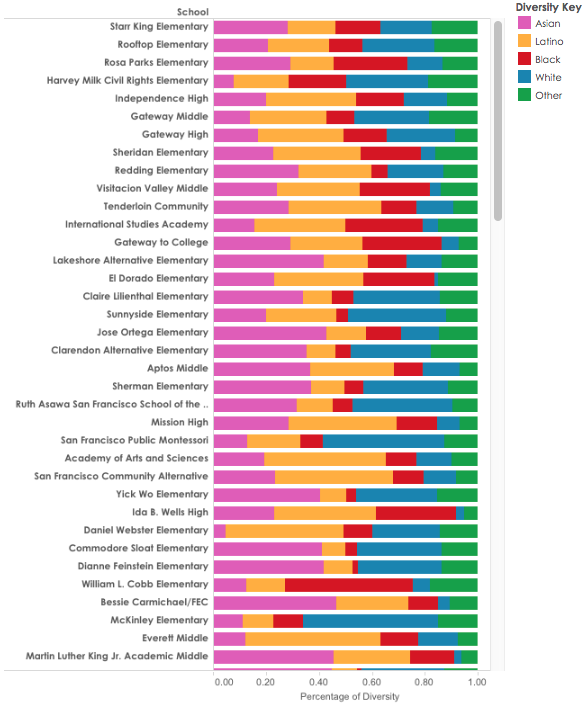
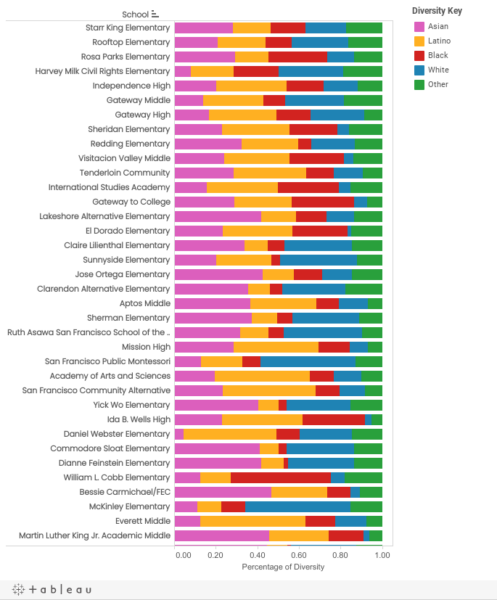
Many schools have super-majorities of Asian or Latino students
Schools across San Francisco show markedly different levels of racial and ethnic diversity. Increasingly over the last five years, schools are dominated by one racial group.
With mathematical tools, it is possible to measure which schools are the most and least diverse. We chose to rank schools using a formula that economists use to tell whether an industry is dominated by monopoly ownership, the Herfindahl-Hirschman index, also known to ecologists as the Simpson diversity index. The idea is the same: Sum up the squares of all the fractions of your sample. The higher the number, the lower the diversity.
The methodology used to identify the demographic categories differed from that used by the California Department of Education in that we collapsed several demographics into broader groups. Specifically, we identified Filipinos as “Asians”; we collapsed Native American, Alaskan Native, Pacific Islander, people listing two races or more and those with unreported demographics into the category “other.”
However, every methodology comes with imperfections. Scoring diversity in this way obscures differences in the school district’s demographic profile, so that the smaller groups, such as “other,” have a disproportionate effect on the overall diversity ranking. In this case, it also does not reflect the actual demographics of the city or the district. Finally, it cannot account for the missions or programs of individual schools, which can sometimes affect ethnic composition.
For example, the “least diverse” is Mission Education Center, which is 98 percent Latino. That should not surprise anyone: The elementary school is for newly arrived Spanish-speaking immigrants, so it lies outside the normal student selection process.
The “most diverse” school in San Francisco Unified is Starr King Elementary in Potrero Hill, which is 28 percent Asian, 19 percent white, 18 percent Latino and 17 percent black. But what our ranking cannot show is that the school contains two programs, Mandarin immersion and general education, which have distinct racial mixes.
This is a ranking of racial diversity as an abstract ideal, without regard to the reality on the ground. It is one – but only one – way of looking at race in the San Francisco Unified School District.
It is not highlighted in this graph, but in analyzing data from the 2013–14 school year, we found that 39 schools are “racially isolated,” meaning that 60 percent or more of students belong to one racial group. But according to the San Francisco Unified School District, there are only 28 such schools (out of 115).
Why the difference? We used U.S. Census definitions of each racial group, which counts Filipinos as Asians. The district does not, seeing Filipinos as a separate ethnic group from blacks, whites, Asians and “other.”
Our decision to count Filipinos as Asians dramatically increased the number of racially isolated schools.
Note: API, or Academic Performance Index, rates schools on a scale from 200 to 1,000 based on standardized tests. Data on free or reduced-price lunches serve as an indicator of poverty.
DATA SOURCES: Demography, California Department of Education district-level data report; API test scores, California Department of Education DataQuest.
This story was published in the winter 2015 print edition of the Public Press. For the full report rolling out online through early February, see sfpublicpress.org/schooldiversity. To read the 2014 report on the effects of parent fundraising and (follow-up coverage), see sfpublicpress.org/publicschools.
