Academic Performance Index vs. Subsidized Lunches for Poor Families
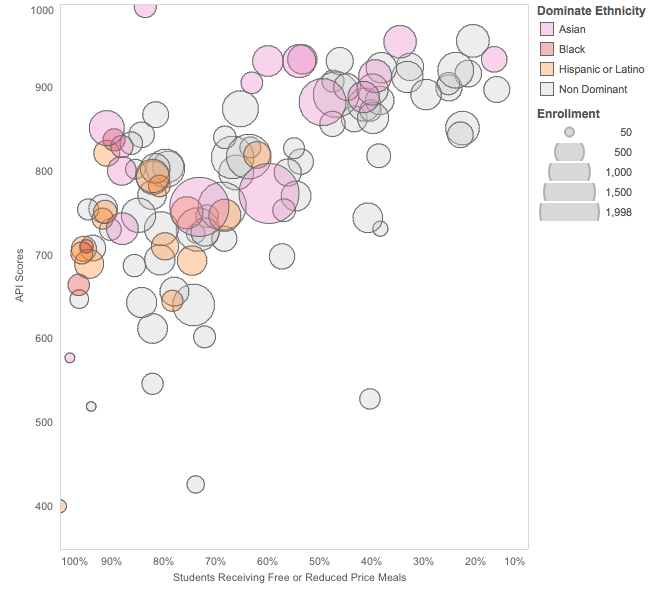
If one looks at the San Francisco Unified School District as a whole, a clear pattern emerges: Schools with the highest level of achievement tend to have the lowest levels of family poverty.
And schools that are identified as “racially isolated” are visibly clustered by both income and achievement.
This plot shows the base Academic Performance Index for each school in the district for which data are available, as well as the percentage of students poor enough to qualify for free and reduced-price lunches, which are used as a proxy for measuring poverty.
The size of the bubble indicates the total enrollment of each school. Colorized circles indicate racially isolated schools that are predominantly Asian, Latino and black. We plotted 111 schools, excluding five due to missing data.
For a student to qualify for subsidized lunches, a family of four must earn no more than $43,568. As of last year, 58 percent of students in the district qualified.
This story was published in the winter 2015 print edition of the Public Press. For the full report rolling out online through early February, see sfpublicpress.org/schooldiversity. To read the 2014 report on the effects of parent fundraising and (follow-up coverage), see sfpublicpress.org/publicschools.


