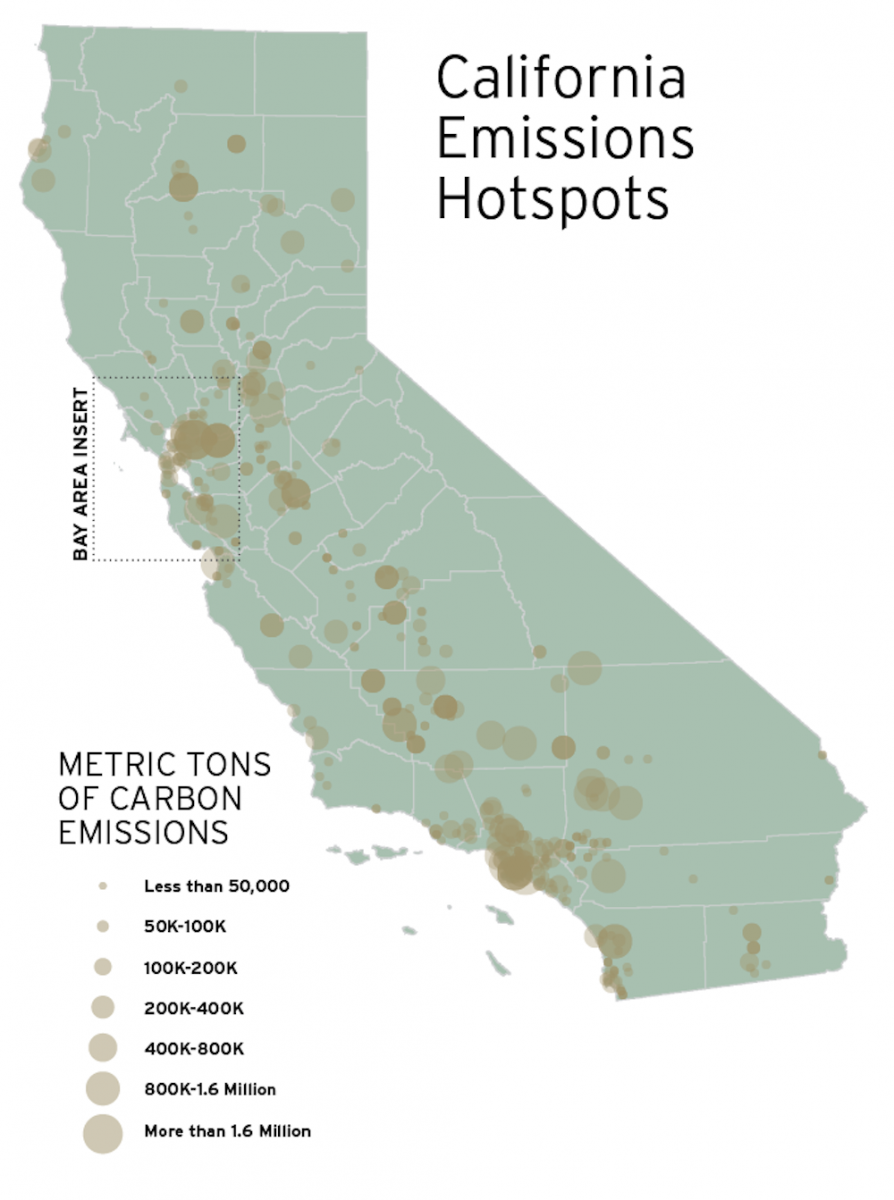
Carbon dioxide, as everyone knows, is invisible. But with a little mapmaking magic, the greenhouse gas comes into sharp view in a rainbow of colors, and shows clearly how and where California contributes to global warming.
California’s cap-and-trade program requires the largest emitters of greenhouse gases to pay to pollute. Each metric ton of carbon dioxide (or other greenhouse gas equivalent) requires an “allowance,” with the total supply (the “cap”) falling each year.
The idea is that the rising carbon prices spur facilities to reduce emissions to save money. Last November, an allowance cost $10.09. In May of this year, the price rose to $14.
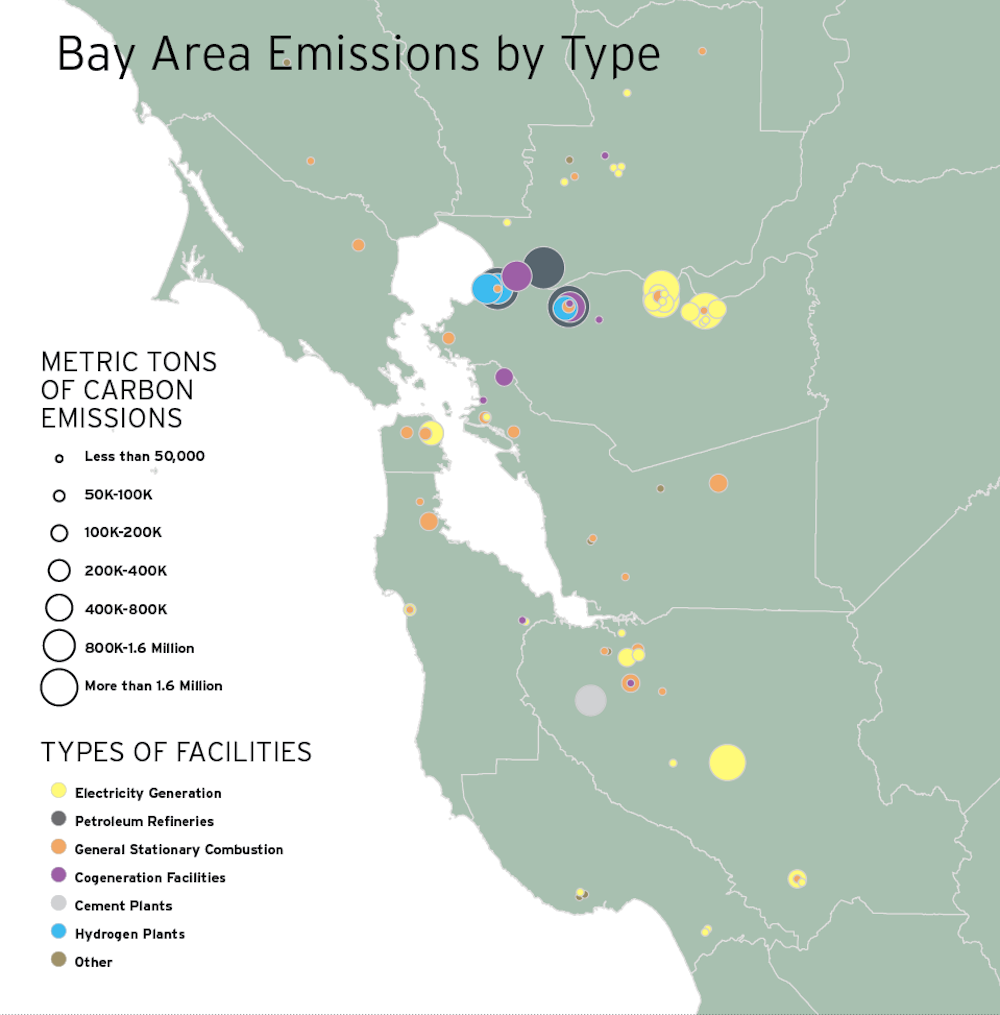
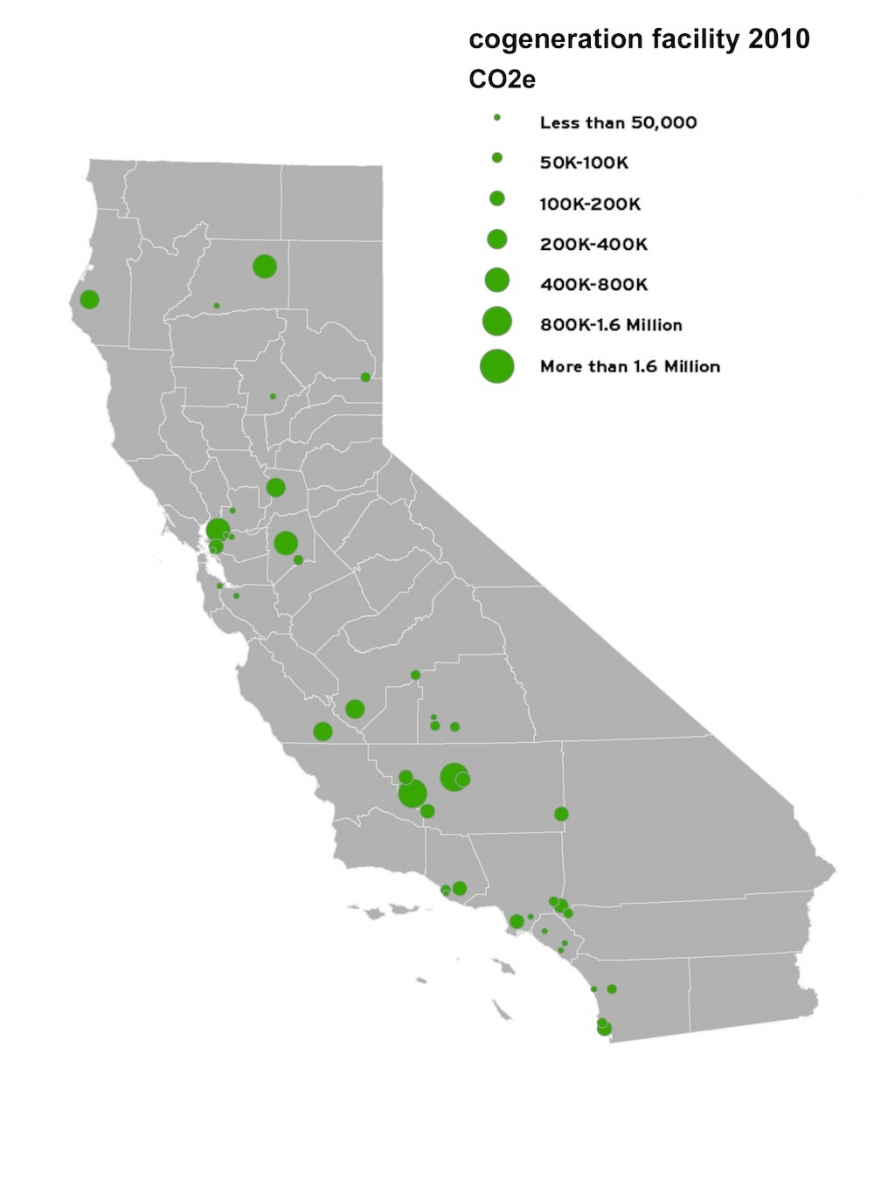
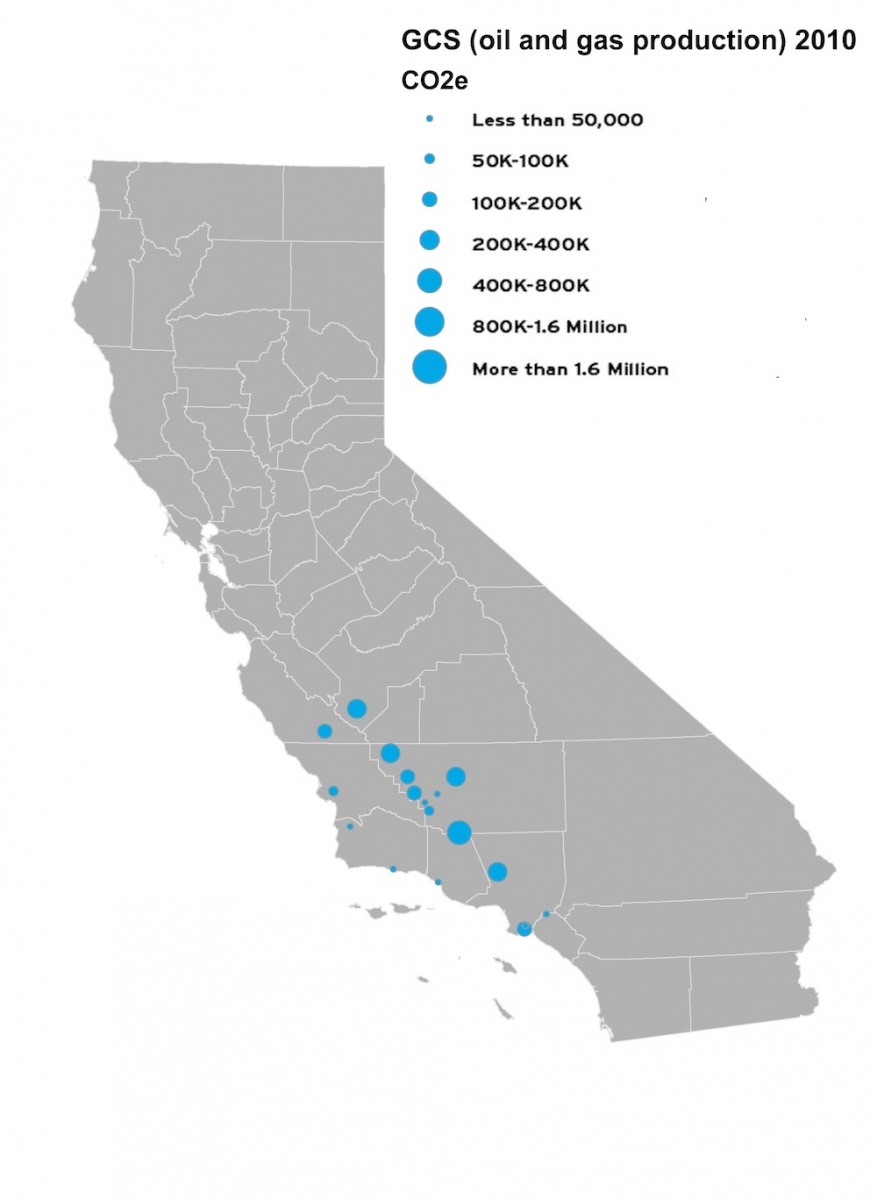
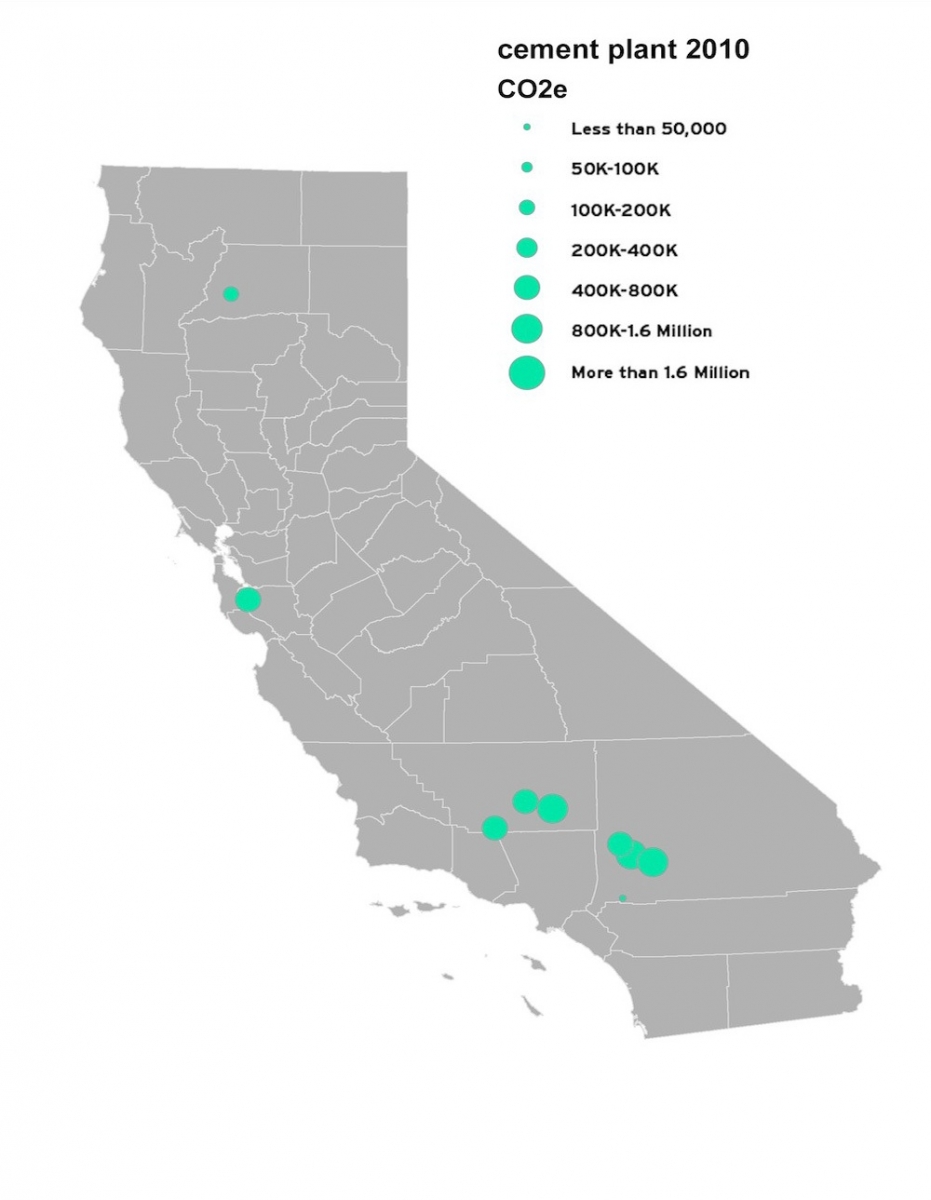
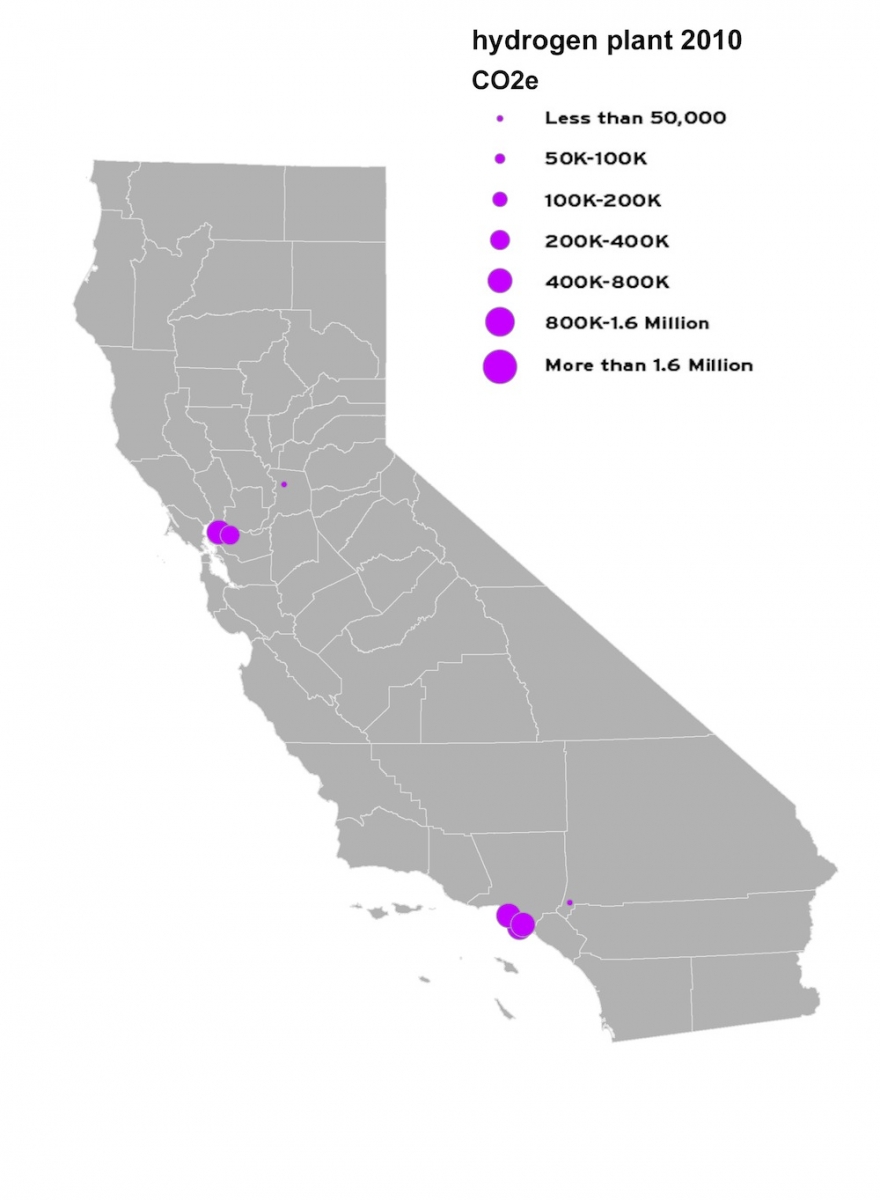
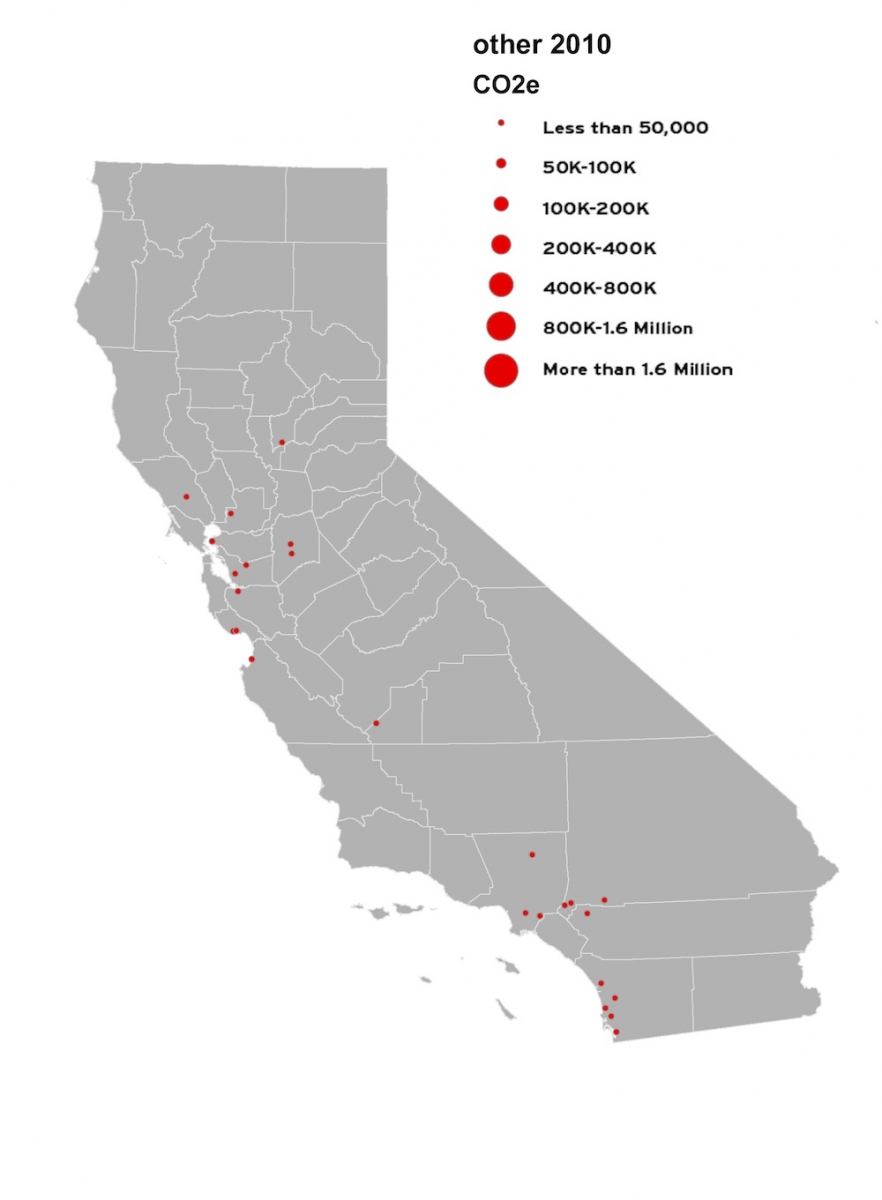
These maps show the largest emitters. The bigger the dot, the more CO2 or other greenhouse gas the facility emits. Locations are approximate. Emissions data from the California Air Resource Board are from the most comprehensive list available, published in 2010. The agency breaks down facilities into eight sectors.
The distribution of polluters around the state clearly shows concentrations of refineries along the coasts, oil and gas extraction in Southern California inland areas, and other types of facilities scattered around the state.
These maps are part of a special report on climate change in the Summer print edition of the San Francisco Public Press, in collaboration with Earth Island Journal and Bay Nature magazine. It was made possible by the Fund for Investigative Journalism.
Research by Noah Arroyo; cartography by Darin Jensen and Mike Jones of the UC Berkeley CAGE Lab.
|
Electricity Generation
|
Petroleum Refineries
|
|
General Stationary Combustion
|
Cogeneration Facilities
|
|
Oil & Gas Production
|
Cement Plants
|
|
Hydrogen Plants
|
Other
|
See also:
Years of Lobbying Helped Transportation Fuels Industry Win Exemptions From California’s Climate Rules, by reporters Ambika Kandasamy and Barbara Grady.
For four years oil companies, airlines and ground transportation industry groups have petitioned California for exemptions from the state’s cap-and-trade greenhouse gas market, saying consumers would take the hit through higher prices at the pump and in stores. And in court they are still arguing that the state lacks the regulatory authority to compel participation. To a degree, they have succeeded.
This story is part of a special report on California’s cap-and-trade program, in collaboration with Earth Island Journal and Bay Nature magazine. It was made possible by the Fund for Investigative Journalism.
Buy a copy of the summer 2013 print edition through the website, or consider becoming a member and get every edition for the next year.
