News
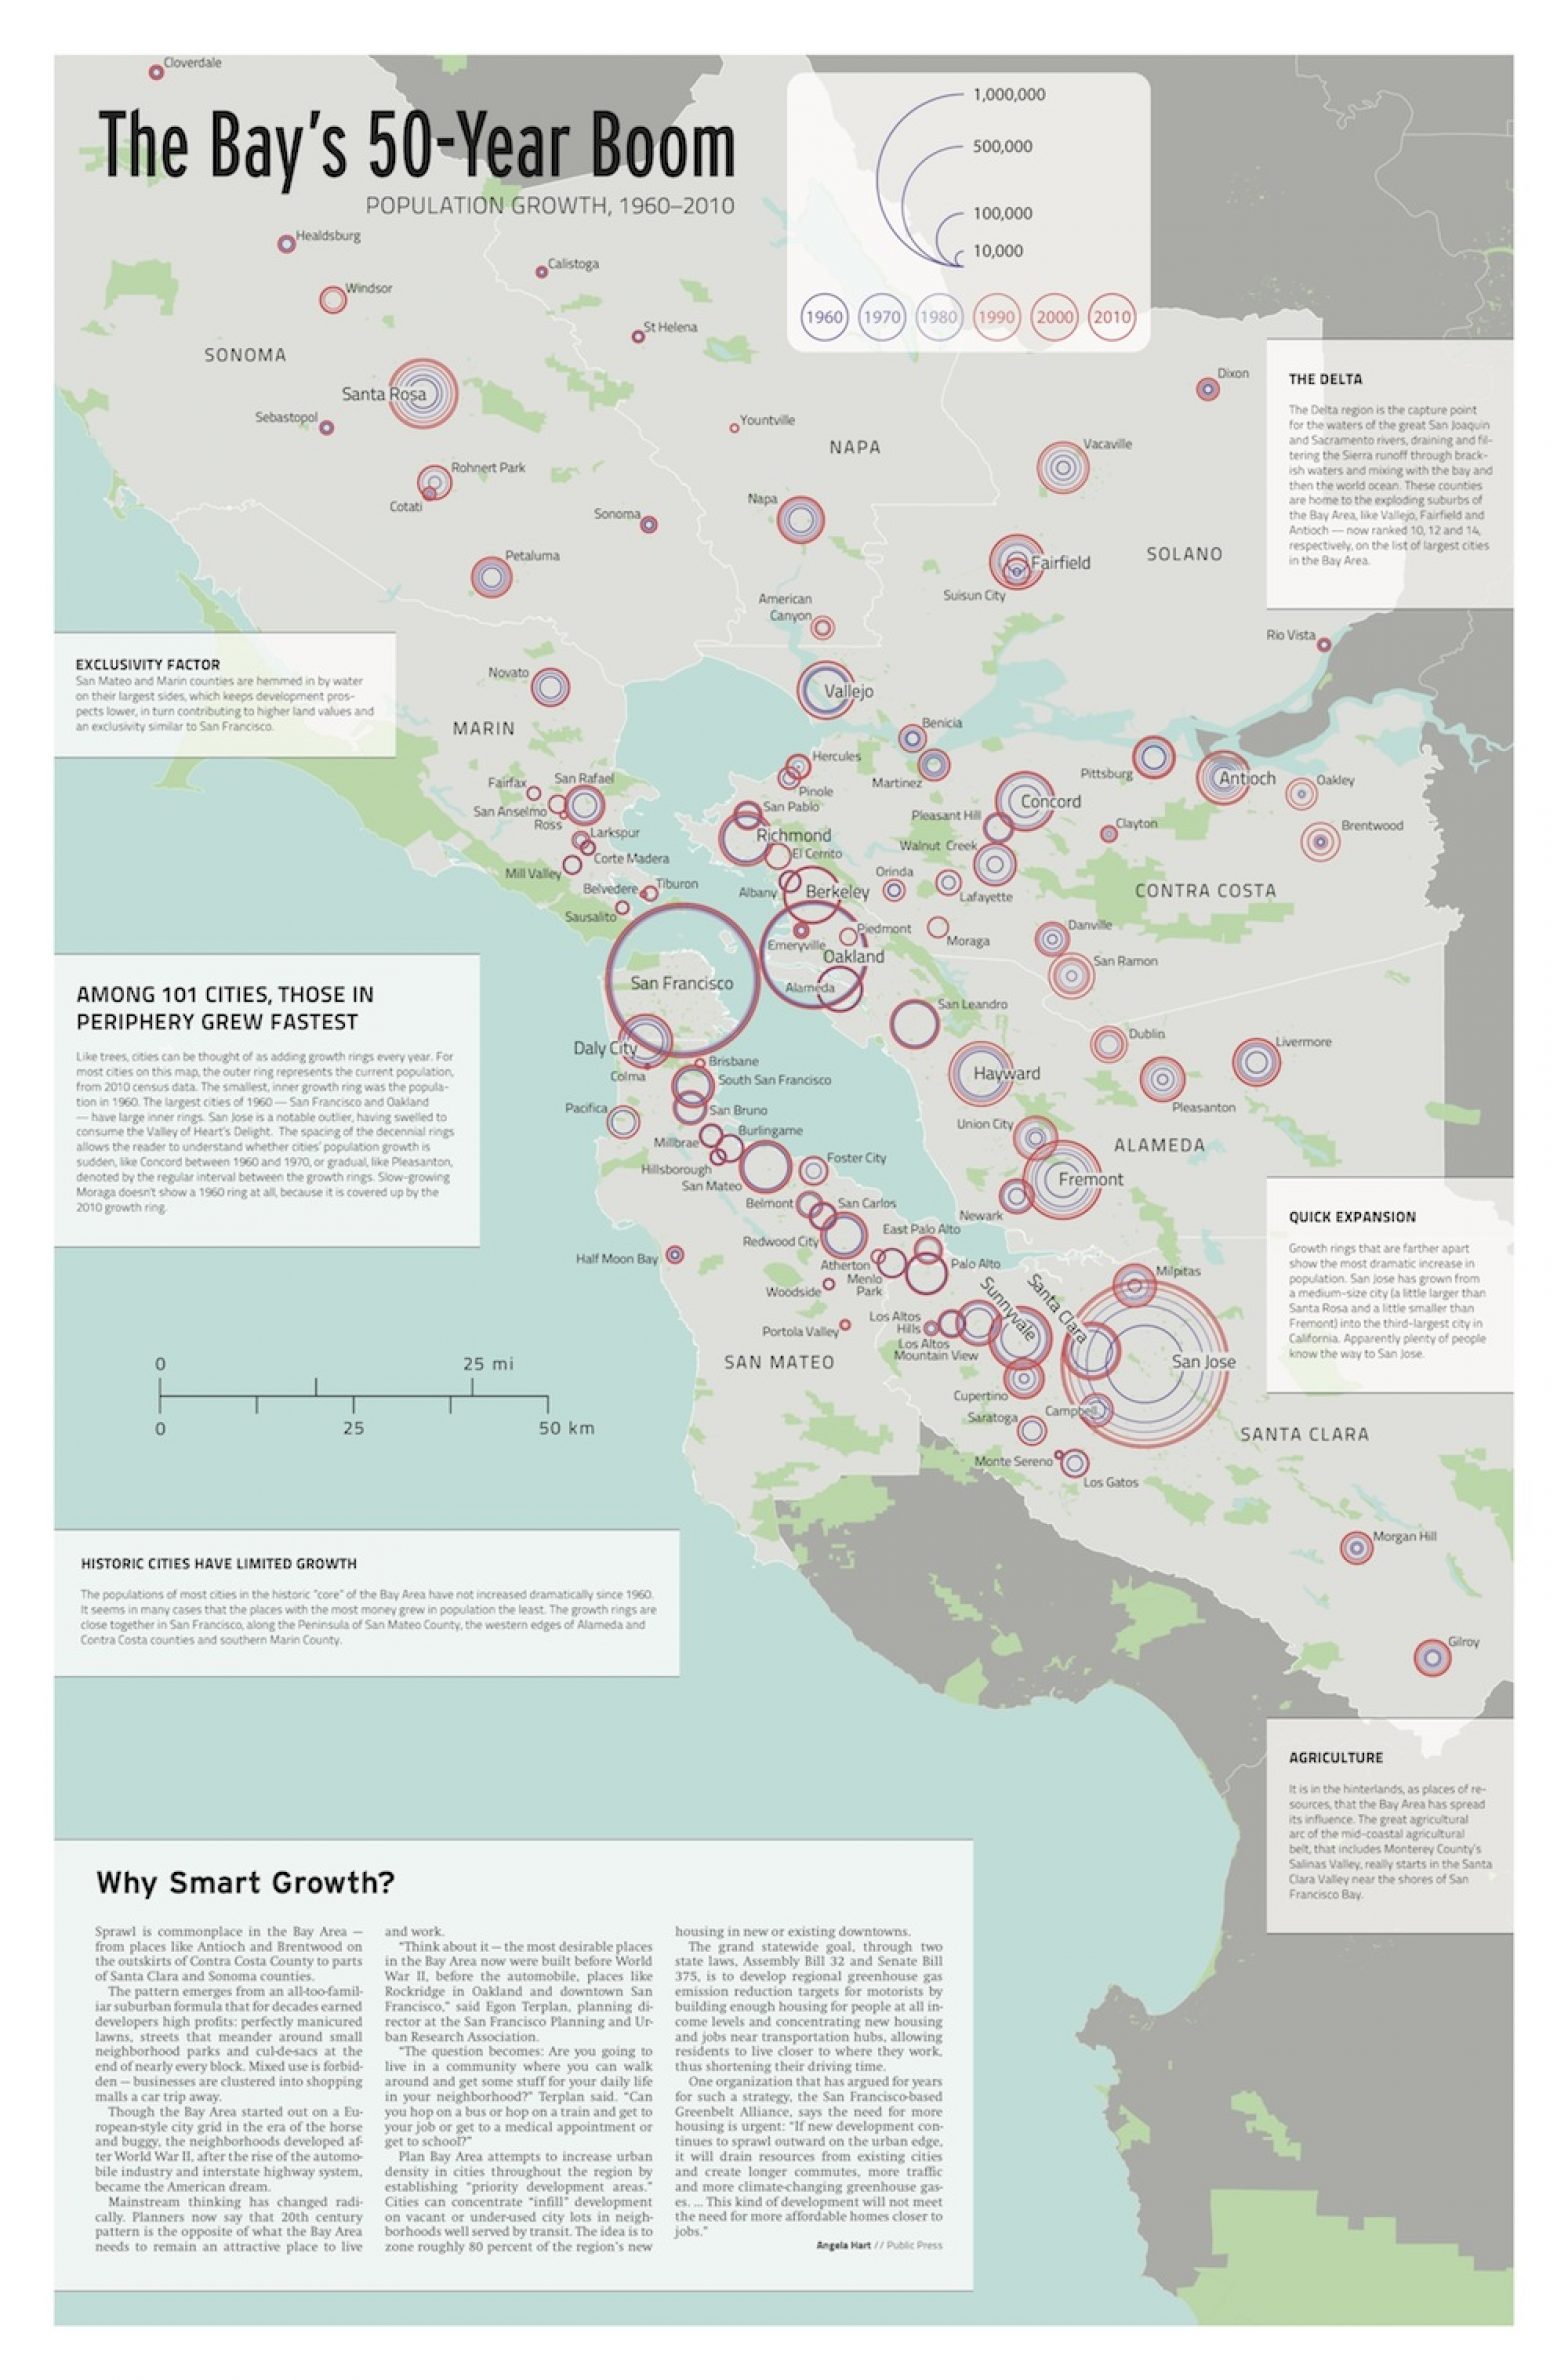
Map: The bay’s 50-year boom — population growth, 1960-2010
Among 101 cities, those in periphery grew fastest
Like trees, cities can be thought of as adding growth rings every year. For most cities on this map, the outer ring represents the current population, from 2010 census data. The smallest, inner growth ring was the population in 1960. The largest cities of 1960 — San Francisco and Oakland – have larger inner rings. San Jose is a notable outlier, having swelled to consume the Valley of Heart’s Delight. The spacing of the decennial rings allows the reader to understand whether cities’ population growth is sudden, like Concord between 1960 and 1970, or gradual, like Pleasanton, denoted by the regular interval between the growth rings. Slow-growing Moraga doesn’t show a 1960 ring at all, because it is covered up by the 2010 growth ring.


