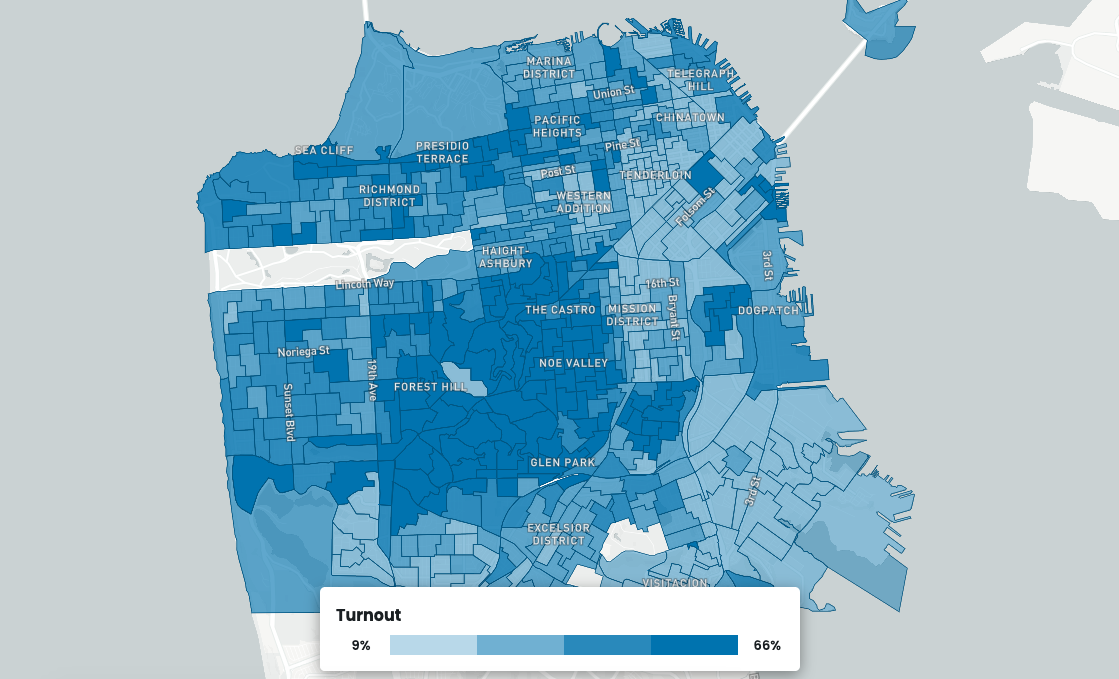
With the majority — but not all — of San Francisco’s votes tallied, a series of maps created by local designer Chris Arvin show how differently, or similarly, residents in different neighborhoods voted from one another by location. Support for certain revenue measures, like the recovery bond Proposition A and the school funding parcel tax Proposition J, enjoyed widespread support. The city was more divided, however, on a measure that would have extended voting rights in municipal elections to 16- and 17-year-olds. On state measure Proposition 22, which carves out an exemption to labor law AB5 for gig economy workers and cements their contractor status, San Franciscans bucked the California trend and voted against the measure — with the exception of certain neighborhoods. Arvin joined “Civic” to discuss the maps and what they show, and a new tool he developed that offers an analysis of the correlations between precinct demographics and contest outcomes.
“We are, like a lot of cities, very separated in terms of a lot of things about us. In terms of race, we’re separated in different neighborhoods. In terms of income, that can change a lot by neighborhood. So seeing how those things compare to the way we vote is really fascinating to me.”
— Chris Arvin
A segment from our radio show and podcast, “Civic.” Listen at 8 a.m. and 6 p.m. Tuesdays and Thursdays at 102.5 FM in San Francisco, or online at ksfp.fm, and subscribe on Apple, Google, Spotify or Stitcher.


