Bicyclists and pedestrians beware: San Francisco’s major commercial corridors are lethal.
Surprised? Probably not. But now you can espy that reality in startling detail on the city’s interactive maps, which show exactly where thousands of unfortunate souls were hurt or killed when they were hit by cars.
The maps are products of the new “Vision Zero” policy agenda, which the city adopted in early 2014 in an effort to make the streets safer following a spate of pedestrian deaths. The maps draw from data that the California Highway Patrol collected between 2005 and 2011, and that city agencies compiled and analyzed.
Click on the maps to go to their interactive sites. There, you can see exactly how many people were hurt at a given intersection.
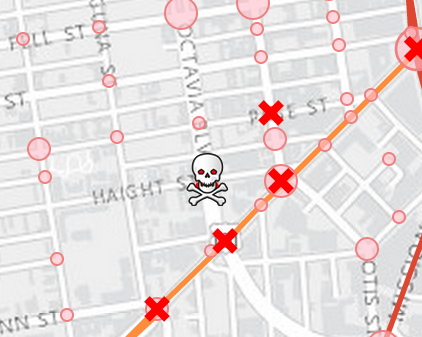
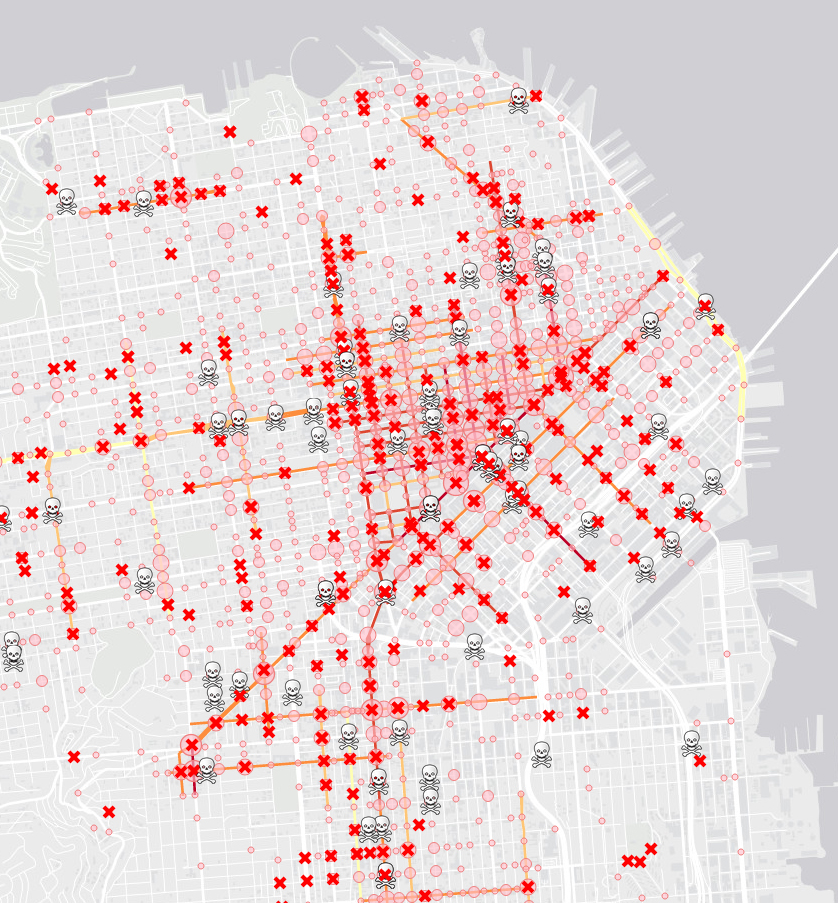
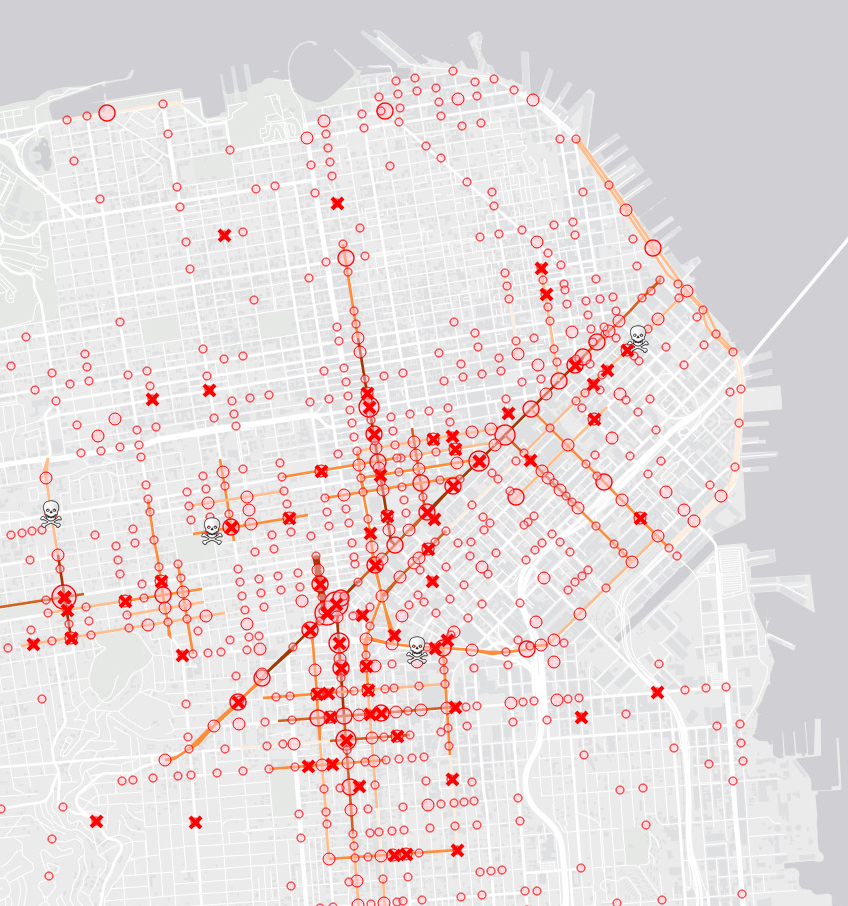
(Skull-and-crossbones represents a death, “X” represents a severe injury, and larger circles mark intersections where accidents frequently occurred.)
Pedestrians: These mapped points account for 5,325 injuries and 127 deaths. Collisions clustered downtown in the Tenderloin, Union Square, Jackson Square and Chinatown neighborhoods. The Mission District was also quite dangerous, as were major thoroughfares like 19th Avenue and Geary Boulevard. (Data from 2005—2011)
Cyclists: Major injuries were clustered along Polk Street in the Tenderloin, as well as Valencia Street in the Mission District. The intersection of Market Street and Octavia Boulevard was especially dangerous, and serious collisions occurred in the Panhandle neighborhood too. (Data from 2007—2011)


